In recent years, we have grown to accept sports betting. Commentators will frequently quote the official odds in a game or share how they would bet. A quiet industry has grown over the same time. In one way, it feels like a new gambling opportunity. In another, it becomes an alternative survey methodology.
Prediction markets—platforms where participants buy and sell contracts that pay out based on real-world events—have grown rapidly and entered mainstream political discourse. This paper argues that, when interpreted carefully, prediction markets can support political surveying by providing a continuous, incentive-driven measure of expectations that can be compared against (and used to stress-test) poll results. Rather than treating markets as replacements for surveys, they are framed as a complementary signal that can help identify uncertainty, detect shifts after news, and flag topics where respondents may be reluctant to answer directly (McHugh, 2025; Wolfers & Zitzewitz, 2004).
Explanation of Prediction Markets
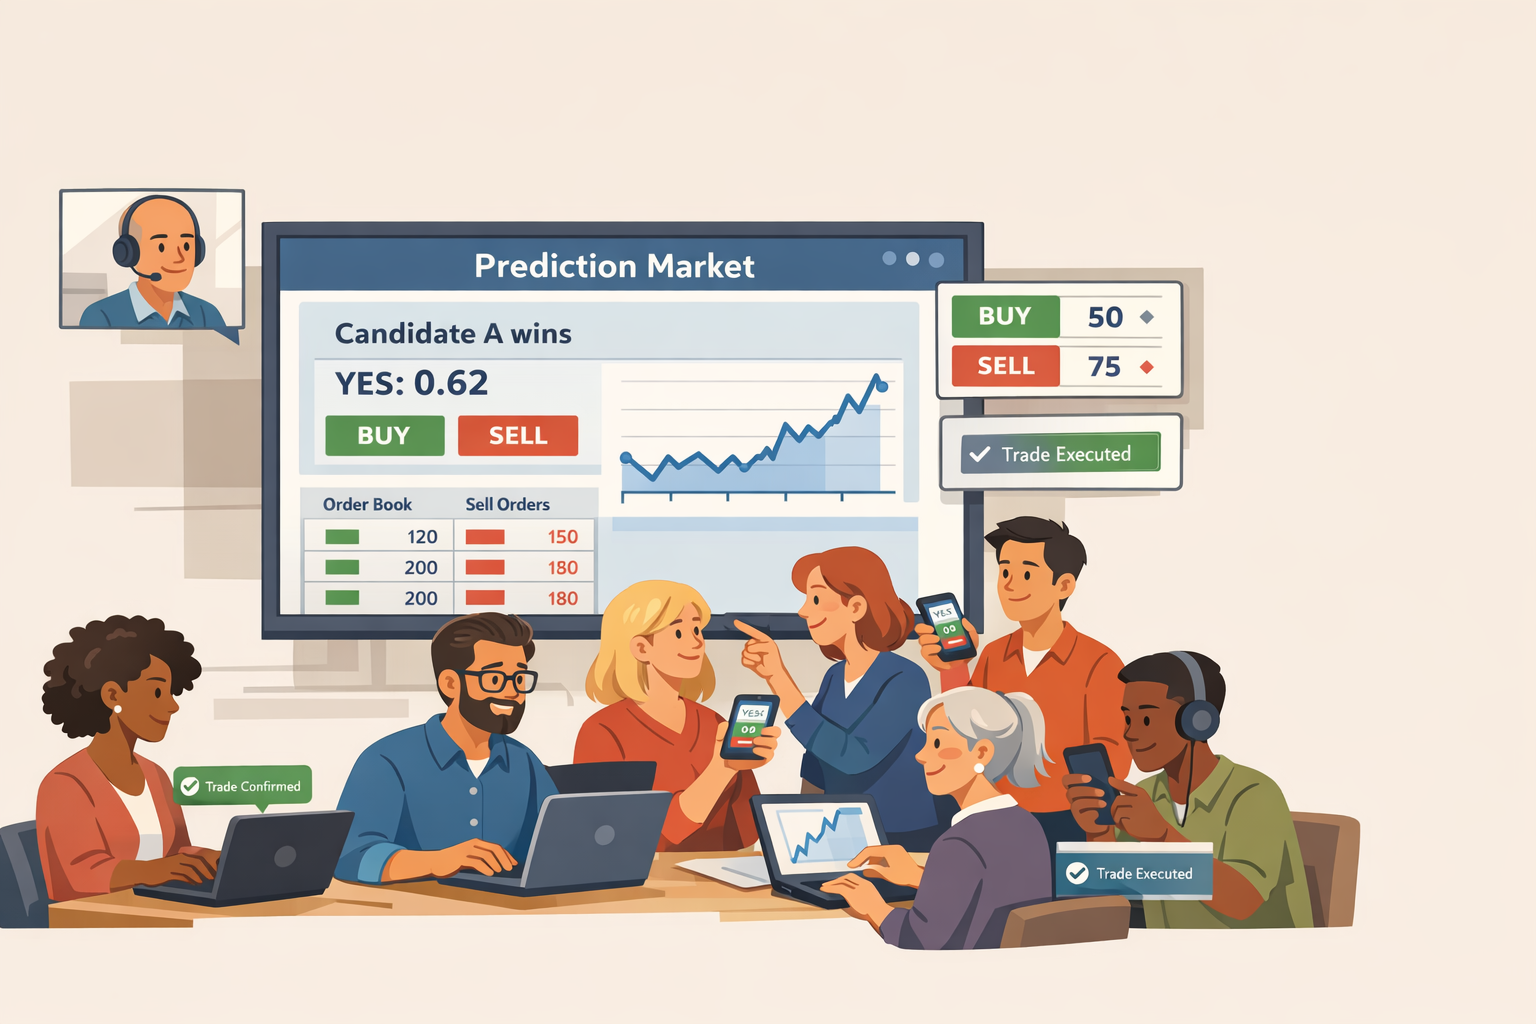
Prediction markets let people buy contracts that pay $1 if a specific event happens. The contract price—usually between 1 and 99 cents—serves as the crowd’s estimate of the likelihood that the event will occur. Trades happen through an order book or an automated market maker, and some platforms use blockchain to make trading and payouts more transparent and automatic (Grayscale Research, 2024; Ballotpedia, 2024). On the individual level, it feels like a bet. At the societal level, it is a prediction based on a large group of interested people.
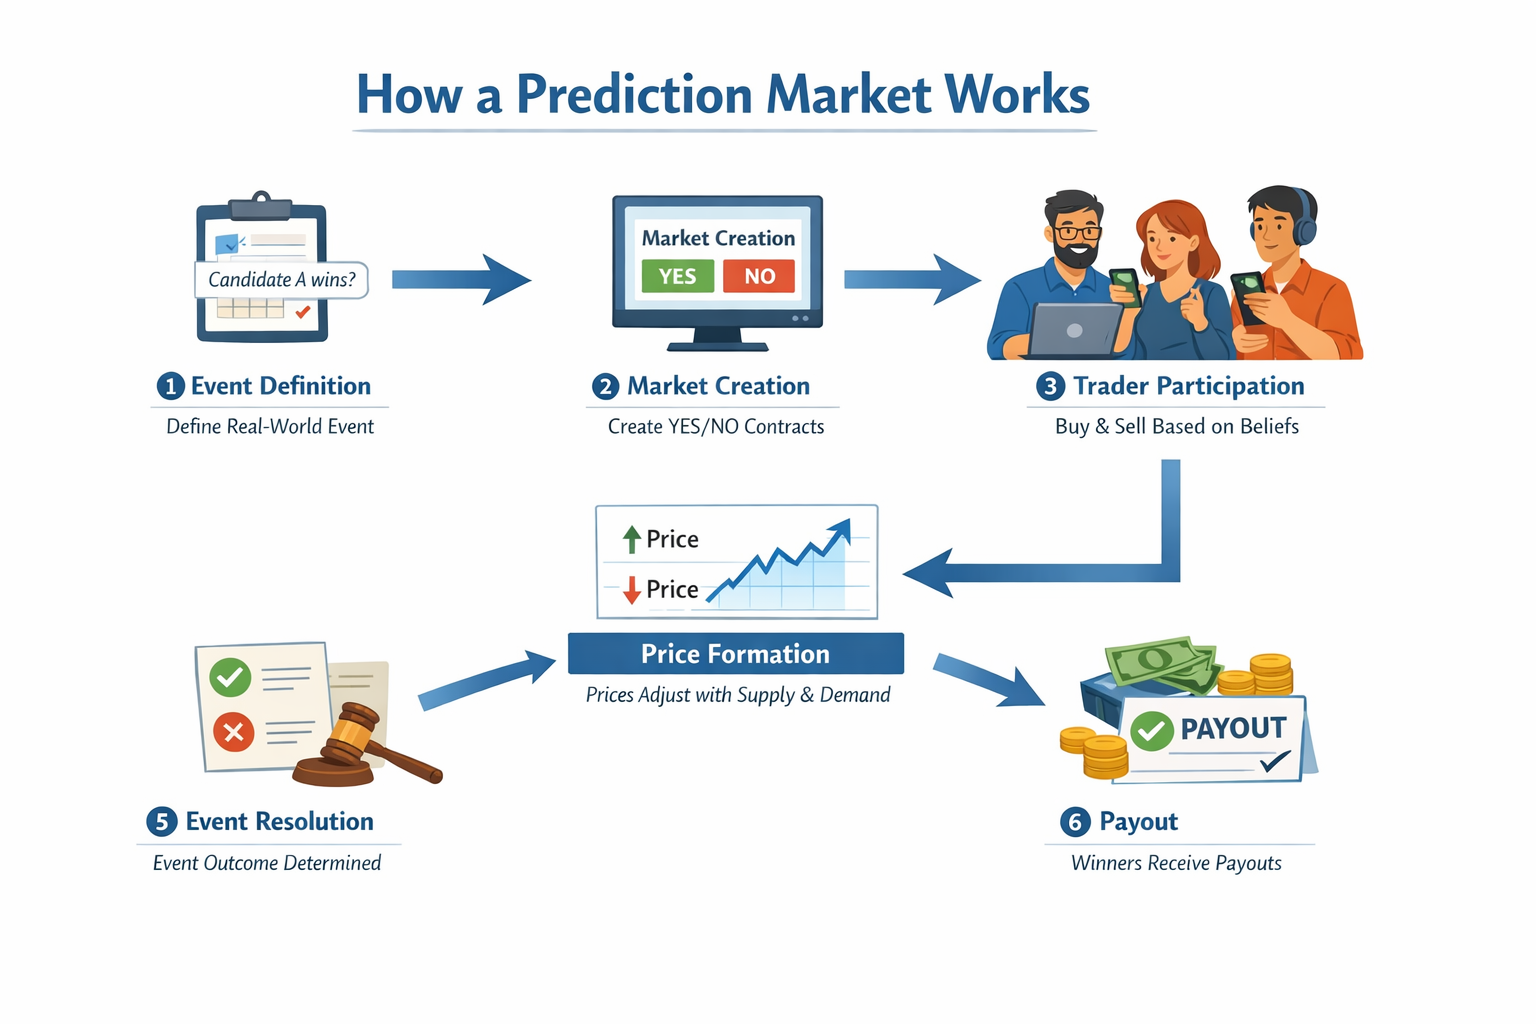
This logic connects directly to the third-person effect. When traders buy a contract, they are not only stating what they personally think will happen; they are pricing what they believe other people will do and what information other people have. In that sense, a prediction market formalizes the “ask about others” approach by turning beliefs about the public into a single number and rewarding accuracy.
Markets differ by design and regulation: academic or low-limit platforms (e.g., PredictIt) cap individual exposure and often show higher accuracy in some studies, while high-liquidity, crypto-native platforms (e.g., Polymarket) can attract large “whale” positions that move prices dramatically. Empirical work shows that liquidity, trader diversity, and clear resolution rules materially affect a market’s resistance to manipulation and its forecasting performance (Wolfers & Zitzewitz, 2004; Choo et al., 2022; Clinton & Huang, 2025; Rasooly & Rozzi, 2025). For survey researchers, the key point is that market prices are best interpreted as an additional measurement stream—one that can corroborate, challenge, or contextualize what respondents tell pollsters.
Third‑Person Questioning as a Survey Technique
A persistent problem in political polling is social desirability bias: people sometimes avoid reporting preferences they fear will be judged negatively, which can be especially salient for polarizing candidates or issues. One practical workaround is to use third-person questioning—shifting from “What will you do?” to “What do you think others will do?”—because respondents may feel more comfortable offering an estimate of their community or the public than disclosing their own view (Tourangeau & Yan, 2007). This paper operationalizes third-person logic as a bridge between surveys and prediction markets: both elicit beliefs about what other people will do, but markets do so continuously and with financial incentives for accuracy.
The third-person effect (TPE) originates in media-effects research and describes a tendency for people to believe persuasive messages influence others more than themselves (Davison, 1983; Tsay–Vogel, 2020). Although TPE is often discussed in the context of support for media regulation, the concept is also useful as a measurement idea: it highlights that people routinely make (and report) judgments about how information will move other people. Prediction markets can be read as a formal, incentive-compatible version of that same inference. A trade is effectively a quantified claim about the public’s likely behavior, and the market price aggregates many such third-person judgments into a single probability-like signal that can be compared with survey results.
Prediction Markets to Anticipate US Elections
In election settings, these contracts are essentially wagers on collective voter behavior—an incentivized estimate of what the broader public will do. Prediction markets were widely used during the 2024 U.S. election cycle and provided timely probability signals that many observers treated as complements to polling and modeling. Cross-platform analyses of the 2024 cycle show mixed results: some platforms (notably PredictIt in Clinton & Huang, 2025) achieved high accuracy across many contracts, while others (Polymarket, Kalshi) exhibited more variable performance and platform-level price divergence for identical events.
Platform-level differences in 2024 election pricing largely come down to liquidity and contract mix. A contract buyer who wants to change their prediction must sell the current prediction to another user. A liquid market will have more traders so contracts can be traded easily as facts come to light—those with deeper order books, higher volume, and more competing traders—tend to incorporate news faster and are harder for any single trader to distort for long, whereas thin markets can swing sharply on a small number of trades and remain mispriced (Wolfers & Zitzewitz, 2004; Servan‑Schreiber et al., 2004; Choo et al., 2022; Rasooly & Rozzi, 2025).
At the same time, platforms often list different portfolios of contracts: some concentrate activity in a handful of high-salience, heavily traded “headline” markets (e.g., the overall winner), while others offer many niche or low-attention markets where trading is sparse (e.g., tie color or scandal). That matters because a platform can appear “more accurate” partly because it is evaluated on easier, higher-volume questions rather than on a broad set of low-liquidity contracts, where pricing is noisier and more manipulable (Clinton & Huang, 2025; Wolfers & Zitzewitz, 2004; Rasooly & Rozzi, 2025).
For survey researchers, a highly liquid election market functions like a continuously refreshed “expectations panel”: as new information arrives, prices update quickly and are less likely to be dominated by a few loud traders. Contract mix matters in a complementary way. Platforms that concentrate activity in clear, high-salience outcome contracts (e.g., who wins) typically produce a cleaner signal than platforms dominated by fragmented, low-volume side markets (e.g., scandals or niche contingencies), where prices can be noisier and easier to move (Wolfers & Zitzewitz, 2004; Servan‑Schreiber et al., 2004; Clinton & Huang, 2025; Choo et al., 2022; Rasooly & Rozzi, 2025).
Implications for Survey Research
Dangers (and why they matter for using markets alongside surveys)
Using prediction markets to complement polling introduces real interpretive risks. First, thin or concentrated markets can be manipulated or temporarily distorted by large traders, creating a misleading “headline probability” that journalists and survey respondents may mistake for public opinion (Choo et al., 2022; Rasooly & Rozzi, 2025). Second, markets may incorporate nonpublic or illicit information if traders act on privileged knowledge, raising legal and ethical concerns and complicating comparisons with survey data that are collected under disclosure and privacy norms (Commodity Futures Trading Commission, 2026; McHugh, 2025). Third, participation is often non-representative—including, on some crypto platforms, global access—which means prices reflect the beliefs and incentives of traders rather than a population sample (Aldridge, 2026). For survey practice, these dangers do not imply that markets are useless; they imply that market signals should be treated as auxiliary data whose reliability depends on liquidity, trader concentration, and the informational environment.
How markets can strengthen survey-based inference
Prediction markets can still add value to survey research when used as a complementary signal. Because prices update continuously, markets can help identify when expectations shift (e.g., immediately after debates, court rulings, or major news), thereby guiding poll timing and questionnaire adjustments. Markets can also provide an external benchmark for topics where surveys may suffer from nonresponse or social desirability pressures, allowing researchers to compare stated intentions to an incentive-weighted expectation signal (Wolfers & Zitzewitz, 2004; Clinton & Huang, 2025). Finally, many of the risks are partially addressable through design choices—position limits, clear resolution rules, and surveillance for suspicious trading—so that the market signal is less likely to be dominated by a few traders (Choo et al., 2022; Rasooly & Rozzi, 2025). In this framing, markets do not replace representative sampling; they enrich interpretation by offering a second, behaviorally grounded measurement channel.
Conclusion
Prediction markets are not a substitute for representative political surveys, but they can be a useful companion measure. In this paper, I argued that markets add value because they convert third-person expectations—beliefs about what other people will do—into continuously updated prices that can be compared against polling toplines, subgroup estimates, and shifts after major events (Davison, 1983; Tsay–Vogel, 2020; Wolfers & Zitzewitz, 2004). Read this way, markets can help survey researchers spot moments of rapid opinion updating, identify topics where direct self-report may be unreliable, and triangulate uncertainty rather than relying on a single instrument (McHugh, 2025; Clinton & Huang, 2025). At the same time, market signals require context: platform liquidity, trader concentration, and contract mix affect how informative prices are and how vulnerable they are to manipulation or noise (Servan‑Schreiber et al., 2004; Choo et al., 2022; Rasooly & Rozzi, 2025). The practical implication is a cautious integration strategy—use markets as auxiliary data with explicit caveats and design-aware checks—so that they strengthen, rather than distract from, survey-based inference.
References
Aldridge, E. (2026, February 25). Everything can be a bet now – the rise and risks of prediction markets. The Conversation. https://theconversation.com/everything-can-be-a-bet-now-the-rise-and-risks-of-prediction-markets-276464
Ballotpedia. (2024). Prediction markets in the 2024 presidential election. https://ballotpedia.org/Prediction_markets_in_the_2024_presidential_election
Choo, X., Kaplan, T. R., & Zultan, R. (2022). Manipulation and (mis)trust in prediction markets. Management Science, 68(9), 6716–6732. https://doi.org/10.1287/mnsc.2021.4246
Clinton, J. D., & Huang, T. (2025). Prediction markets? The accuracy and efficiency of $2.4 billion in the 2024 presidential election (Working paper). SocArXiv. https://osf.io/preprints/socarxiv/d5yx2_v1
Commodity Futures Trading Commission. (2026, February 25). CFTC Enforcement Division issues prediction markets advisory (Press Release No. 9185-26). https://www.cftc.gov/PressRoom/PressReleases/9185-26
Davison, W. P. (1983). The third-person effect in communication. Public Opinion Quarterly, 47(1), 1–15. https://doi.org/10.1086/268763
Grayscale Research. (2024). Polymarket: Crypto’s election‑year breakout app. https://research.grayscale.com/reports/polymarket
McHugh, C. (2025, October 24). Pollsters have a new kind of competitor. POLITICO Magazine. https://www.politico.com/news/magazine/2025/10/24/political-betting-markets-political-predictions-accuracy-00620431
Rasooly, I., & Rozzi, R. (2025). How manipulable are prediction markets? arXiv. https://doi.org/10.48550/arXiv.2503.03312
Servan‑Schreiber, E., Wolfers, J., Pennock, D. M., & Galebach, B. (2004). Prediction markets: Does money matter? Electronic Markets, 14(3), 243–251. http://users.nber.org/~jwolfers/Papers/DoesMoneyMatter.pdf
Tourangeau, R., & Yan, T. (2007). Sensitive questions in surveys. Psychological Bulletin, 133(5), 859–883. https://doi.org/10.1037/0033-2909.133.5.859
Tsay‑Vogel, M. (2020). Third‑person effect. In J. Bulck (Ed.), The International Encyclopedia of Media Psychology. Wiley. https://doi.org/10.1002/9781119011071.iemp0143
Wolfers, J., & Zitzewitz, E. (2004). Prediction markets. Journal of Economic Perspectives, 18(2), 107–126. https://doi.org/10.1257/0895330041371321
Overview of the draft paper
Your draft already establishes a clear narrative: prediction markets promise information aggregation but face manipulation and representativeness problems, especially for U.S. social‑issue markets. It covers the right topics (mechanics, third‑person effect, election performance, risks/benefits) and frames a researchable question about international participation and market distortion.
Strengths to preserve
- Clear structure
— sections map directly to the user’s requested outline. - Balanced tone
— acknowledges both informational value and manipulation risks. - Actionable framing
— points toward design and regulatory mitigations that can be tested empirically.
High‑impact areas to enhance
- Literature and citations
— what to do: replace or supplement the current citations with peer‑reviewed studies, working papers, and authoritative reports (CFTC, Atlantic Council, academic journals on markets and media effects). Why: strengthens credibility and avoids reliance on news or blog sources alone. - Operationalizing “international participation”
— what to do: define metrics (IP geolocation of trades, account self‑reported residency, blockchain wallet clustering, time‑zone patterns, currency flows). Why: makes the hypothesis testable and reproducible. - Market selection and scope
— what to do: specify which platforms and contract types you’ll analyze (e.g., high‑liquidity election contracts vs. low‑liquidity social‑issue contracts). Why: performance and vulnerability vary by market type. - Empirical design
— what to do: propose a quasi‑experimental or observational strategy (difference‑in‑differences around exogenous shocks, event‑study around coordinated information campaigns, or instrumental variables using platform outages or regulatory changes). Why: causal claims require careful identification. - Data sources and access
— what to do: list concrete data sources (platform trade histories, order books, on‑chain transaction records, media coverage timestamps, social‑media amplification metrics). Why: shows feasibility and anticipates reviewer questions. - Robustness checks
— what to do: plan tests for liquidity effects, trader concentration (Gini of trade volume), time‑of‑day patterns, and alternative resolution definitions. Why: rules out spurious findings. - Ethics and legal considerations
— what to do: add a short section on privacy, platform terms of service, and regulatory constraints (e.g., U.S. access limits). Why: research involving trading data and geolocation raises ethical and legal issues. - Narrative and policy implications
— what to do: tighten the conclusion to link empirical findings to concrete policy options (exposure limits, geographic gating, disclosure rules) and tradeoffs. Why: makes the paper useful to regulators and platform designers.
Concrete suggestions for revision (practical edits)
- Introduction
: tighten the research question into a single sentence and preview the empirical strategy. - Prediction markets section
: add a short table comparing platform designs (order book vs. AMM; fiat vs. crypto; residency gating). - Third‑person effect section
: include one or two empirical findings from media‑effects literature that quantify the perceptual gap. - Use of markets for elections
: add a brief timeline of 2024 market performance with platform‑level differences (avoid asserting winners; focus on relative accuracy and liquidity). - Dangers and possibilities
: convert the list into paired “Risk → Mitigation” bullets to make tradeoffs explicit. - Methods appendix
: sketch code/data pipelines, variable definitions, and pre‑registration plans.
Next steps you can take now
- Assemble a target bibliography
of 10–15 peer‑reviewed or working‑paper sources on prediction markets, market manipulation, and third‑person effects. - Request or scrape sample trade data
from one or two platforms to test feasibility of geolocation and liquidity measures. - Draft a short methods paragraph
that you can show to collaborators or an IRB to check legal/ethical constraints. - Create a one‑page table
mapping each hypothesis to the data and test you’ll run.
Would you like a prioritized reading list (peer‑reviewed papers, working papers, and policy reports) tailored to the empirical design you prefer (e.g., event‑study vs. cross‑sectional analysis)?
Prioritized reading list for an empirical study on international influence and manipulation in U.S. prediction markets
Core empirical studies (start here)
- Rasooly & Rozzi (2025). How manipulable are prediction markets? (arXiv)
— Field‑experiment evidence that trades can produce persistent price effects; useful for experimental design and expected effect sizes. arXiv.org +13 - Clinton & Huang (2025). Prediction Markets? The Accuracy and Efficiency of $2.4 Billion in the 2024 Presidential Election (SocArXiv / working paper)
— Large cross‑platform analysis of 2024 political markets showing platform‑level accuracy differences and inefficiencies; essential for benchmarking and outcome measures. - Sirolly, Kanoria, Ma, & Sethi (2025). Network‑Based Detection of Wash Trading (PredictionNews summary of academic work)
— Methods for detecting wash trading on blockchain platforms; directly relevant to measuring non‑informational volume and coordinated wallet clusters.
Market data, platform case studies, and industry analysis
- Polymarket statistics and platform analyses (The Block; Worldmetrics; Allied Venture Partners)
— High‑level metrics on volume, user growth, and event concentration during 2024; use for context, plausibility checks, and sample selection. - Atlantic Council, “Weaponizing the odds” (2026)
— Policy‑oriented analysis of how markets can be paired with information operations; useful for framing threat models and media‑amplification channels.
Regulation, enforcement, and legal context
- CFTC Enforcement Division advisory (Feb 25, 2026)
— Official guidance and enforcement priorities (insider trading, wash sales, disruptive trading); necessary for legal/ethical design constraints and data‑access considerations. - Baker McKenzie / Sidley Austin analyses (2026)
— Practical summaries of regulatory risk and compliance options for platforms and researchers; helpful for IRB and data‑sharing planning.
Third‑person effect and media‑effects literature (theory + measurement)
- Lyons (2022). Why we should rethink the third‑person effect (Journal of Communication)
— Reframes TPE measurement and distinguishes earned differences from overconfidence; useful for operationalizing survey measures that complement market data. - Liu & Huang (2020). Digital Disinformation and the Third‑Person Effect (Cyberpsychology, Behavior, and Social Networking)
— Empirical study linking TPE to disinformation exposure and emotional outcomes; useful for hypothesizing how perceived susceptibility shapes media campaigns that could target markets.
Methods and robustness checks (market microstructure, detection, and causal inference)
- Papers on market efficiency and anomalies (e.g., Pennock et al., Wolfers & Zitzewitz, Dreber et al.)
— Classic methods for testing informational efficiency, Brier/log‑loss scoring, and martingale tests; use these to evaluate price signals and construct accuracy metrics. - Network and on‑chain methods for wallet clustering and wash‑trade detection
— Implement algorithms like those in the Sirolly et al. study to flag coordinated wallets and synthetic volume; critical for separating genuine liquidity from manipulation.
How to use these readings in your empirical plan
- Design choice (event‑study vs cross‑sectional):
- Use Rasooly & Rozzi and Sirolly et al. to build an event‑study that tests price responses to exogenous shocks (e.g., coordinated trades, media pushes) and persistence of effects.
- Use Clinton & Huang and platform statistics to construct a cross‑sectional analysis comparing market accuracy, liquidity, and foreign‑trade share across platforms and contract types.
- Key variables to extract or construct:
- Market outcome accuracy
(Brier score, log‑loss). - Liquidity and concentration
(daily volume, open interest, Gini of trade sizes). - International participation proxies
(wallet geolocation, time‑zone activity, currency flows, KYC residency where available). - Manipulation signals
(wash‑trade clusters, rapid round‑trip trades, anomalous win rates). - Media amplification
(timestamps of major news/social posts vs. price moves).
- Market outcome accuracy
- Identification strategies and robustness checks:
- Event‑study
around detected coordinated trades or sudden media pushes; compare treated vs control markets. - Instrumental variables
using exogenous platform outages, regulatory announcements, or token‑airdrop eligibility rules to isolate exogenous variation in international activity. - Placebo tests
on high‑liquidity election markets vs low‑liquidity social‑issue markets (expect different susceptibility).
- Event‑study
Quick reading order (recommended)
- Clinton & Huang (2025)
— cross‑platform benchmarking and accuracy metrics. - Rasooly & Rozzi (2025)
— experimental evidence on manipulability. - Sirolly et al. / wash‑trading detection
— methods for on‑chain manipulation detection. - Atlantic Council & CFR pieces
— threat framing and policy context. - CFTC advisory and legal summaries
— regulatory constraints and enforcement priorities. - Third‑person effect theory papers (Lyons 2022; Liu & Huang 2020)
— to link market signals to perceptions about “others.”
Would you like a one‑page methods sketch (hypotheses, data sources, variable definitions, and identification strategy) tailored to an event‑study or a cross‑sectional design so you can take it directly to collaborators or an IRB?
